Alerts & Notifications
Configure alert rules, notification channels, and manage the alert lifecycle in TINAA MSP.
Alerts and Notifications
TINAA MSP continuously evaluates quality signals and fires alerts when configured thresholds are breached. Alerts ensure you hear about regressions, downtime, and quality drops before your users do.
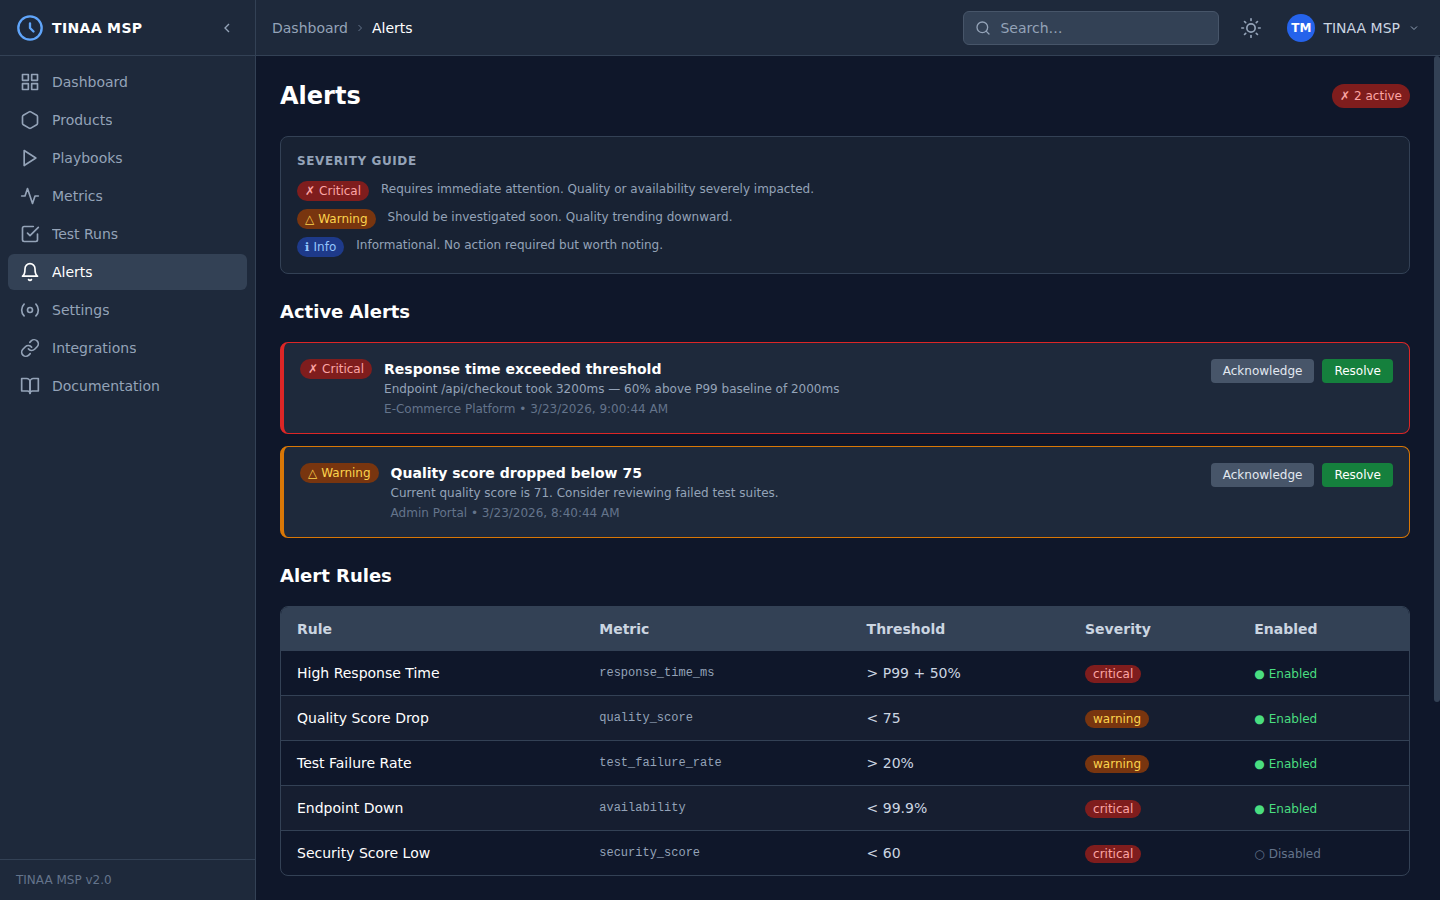
Alert System Overview
The TINAA alert engine evaluates alert rules after every:
- Synthetic monitoring check (availability, response time)
- Playbook run or test suite completion
- Quality score recalculation
- Deployment event
When a rule’s condition is met, TINAA fires an alert and delivers it to all configured channels. A cooldown period (default: 30 minutes) prevents the same rule from firing again until the condition has cleared and re-triggered.
Severity Levels
| Severity | Color | Meaning | Typical response |
|---|---|---|---|
| Critical | Red | Service is down or severely degraded | Page on-call immediately |
| Warning | Yellow | Quality is degrading — action needed soon | Review within 1–4 hours |
| Info | Blue | Noteworthy change — no immediate action required | Review in daily standup |
Built-In Alert Rules
TINAA ships with a set of default alert rules that are active for all products from day one. You can adjust their thresholds or disable them per product.
| Rule name | Condition | Default severity | Default threshold |
|---|---|---|---|
| High Response Time | endpoint_degraded |
Warning | P95 > 2,000 ms |
| Quality Score Drop | quality_score_drop |
Warning | Drop of 10+ points since last check |
| Quality Score Below Threshold | quality_score_below |
Critical | Score < 60 |
| Test Failure Rate | test_suite_failure |
Warning | Any test suite with failures |
| Endpoint Down | endpoint_down |
Critical | 3 consecutive failed checks |
| Security Score Low | security_issue |
Warning | Security component < 70 |
| Availability Drop | availability_drop |
Critical | Availability < 99.0% |
| Error Rate Spike | error_rate_spike |
Warning | Error rate > 5% |
Creating Custom Alert Rules
Via the Dashboard
- Navigate to Alerts in the left sidebar
- Click Create Rule
- Select the product and condition type
- Configure the threshold values
- Choose one or more notification channels
- Set the severity and cooldown period
- Click Save Rule
Via the REST API
1
2
3
4
5
6
7
8
9
10
11
12
13
14
POST /api/v1/products/{product_id}/alerts/rules
Content-Type: application/json
X-API-Key: <your-api-key>

{
  "name": "checkout-lcp-alert",
  "condition_type": "performance_regression",
  "severity": "warning",
  "threshold": {
    "regression_percent": 20
  },
  "channels": ["slack", "email"],
  "cooldown_minutes": 60
}
Via MCP (Claude Code)
1
2
3
4
5
6
7
8
9
10
11
12
13
14
15
configure_alerts(
  product_id_or_slug="checkout-service",
  rules=[
    {
      "type": "quality_score_drop",
      "threshold": 10,
      "channels": ["slack:#alerts"]
    },
    {
      "type": "endpoint_down",
      "threshold": 3,
      "channels": ["pagerduty"]
    }
  ]
)
Alert Condition Types
| Condition type | Threshold keys | Description |
|---|---|---|
quality_score_drop |
drop_amount |
Score dropped by N+ points |
quality_score_below |
min_score |
Score fell below threshold |
test_failure |
max_failures |
Individual test failures |
test_suite_failure |
max_failures |
Suite-level failures |
performance_regression |
regression_percent |
Response time increased by N% |
endpoint_down |
consecutive_failures |
N consecutive failed checks |
endpoint_degraded |
max_response_time_ms |
Response time exceeds budget |
availability_drop |
min_availability |
Uptime fell below N% |
error_rate_spike |
max_error_rate |
Error rate exceeded N% |
security_issue |
min_score |
Security component fell below N |
accessibility_regression |
max_violations |
New WCAG violations detected |
Alert Channels
Slack
Post alerts to a Slack channel via a Slack Incoming Webhook URL.
Setup:
- In Slack, go to Your workspace > Apps > Incoming Webhooks
- Click Add New Webhook to Workspace
- Choose the channel and click Allow
- Copy the webhook URL
Configure in TINAA:
1
2
3
4
5
6
7
8
9
POST /api/v1/settings/integrations/slack
Content-Type: application/json
X-API-Key: <your-api-key>

{
  "webhook_url": "https://hooks.slack.com/services/T.../B.../...",
  "default_channel": "#alerts",
  "mention_on_critical": "@here"
}
Alert messages include: product name, severity, condition, current value vs. threshold, and a link to the TINAA dashboard.
Microsoft Teams
Post alerts to a Teams channel via an Incoming Webhook connector.
Setup:
- In Teams, open the channel and click … > Connectors
- Search for Incoming Webhook and click Configure
- Give the webhook a name and upload an icon (optional)
- Copy the webhook URL
Configure in TINAA:
1
2
3
4
5
6
7
POST /api/v1/settings/integrations/teams
Content-Type: application/json
X-API-Key: <your-api-key>

{
  "webhook_url": "https://myorg.webhook.office.com/webhookb2/..."
}
Send alert emails via SMTP.
Configure in TINAA:
1
2
3
4
5
6
7
8
9
10
11
12
13
POST /api/v1/settings/integrations/email
Content-Type: application/json
X-API-Key: <your-api-key>

{
  "smtp_host": "smtp.example.com",
  "smtp_port": 587,
  "smtp_username": "tinaa-alerts@example.com",
  "smtp_password": "smtp-password",
  "from_address": "tinaa-alerts@example.com",
  "to_addresses": ["oncall@example.com", "team-lead@example.com"],
  "use_tls": true
}
Or via environment variables (see Configuration Reference):
1
2
3
4
5
TINAA_SMTP_HOST=smtp.example.com
TINAA_SMTP_PORT=587
TINAA_SMTP_USERNAME=tinaa-alerts@example.com
TINAA_SMTP_PASSWORD=...
TINAA_ALERT_EMAIL_TO=oncall@example.com
PagerDuty
Create PagerDuty incidents for critical alerts.
Setup:
- In PagerDuty, go to Services > Service Directory
- Create a new service (or use an existing one)
- Add an Events API v2 integration
- Copy the Integration Key
Configure in TINAA:
1
2
3
4
5
6
7
8
9
10
11
12
POST /api/v1/settings/integrations/pagerduty
Content-Type: application/json
X-API-Key: <your-api-key>

{
  "integration_key": "a1b2c3d4e5f6...",
  "severity_mapping": {
    "critical": "critical",
    "warning": "warning",
    "info": "info"
  }
}
Only alerts with severity critical or warning create PagerDuty incidents by default. Adjust the severity_mapping to control which TINAA severities trigger pages.
Webhooks
POST a JSON payload to any HTTP endpoint when an alert fires.
Configure in TINAA:
1
2
3
4
5
6
7
8
9
POST /api/v1/settings/integrations/webhooks
Content-Type: application/json
X-API-Key: <your-api-key>

{
  "url": "https://my-alert-receiver.example.com/tinaa-webhook",
  "secret": "webhook-signing-secret",
  "events": ["alert.triggered", "alert.resolved", "alert.acknowledged"]
}
The HMAC-SHA256 signature of the request body is sent in the X-TINAA-Signature header so you can verify the authenticity of incoming webhooks.
Webhook payload:
1
2
3
4
5
6
7
8
9
10
11
12
13
14
15
16
17
{
  "event": "alert.triggered",
  "alert": {
    "rule_name": "checkout-lcp-alert",
    "severity": "warning",
    "condition_type": "performance_regression",
    "message": "LCP increased by 35% on /checkout (3,375 ms vs. baseline 2,500 ms)",
    "product_id": "checkout-service",
    "environment": "production",
    "triggered_at": "2026-03-23T10:15:00Z",
    "details": {
      "current_lcp_ms": 3375,
      "baseline_lcp_ms": 2500,
      "regression_percent": 35
    }
  }
}
GitHub Issues
Automatically open a GitHub issue when a regression is detected.
Configure in TINAA (requires GitHub integration):
1
2
3
4
5
6
7
8
9
10
11
POST /api/v1/settings/integrations/github-issues
Content-Type: application/json
X-API-Key: <your-api-key>

{
  "enabled": true,
  "repo": "myorg/my-web-app",
  "labels": ["quality", "regression", "automated"],
  "assignees": ["oncall-developer"],
  "severity_filter": ["critical", "warning"]
}
Issues are created with a structured title ([TINAA] Quality regression: <rule name>) and a body that includes the alert details, a link to the metrics dashboard, and suggested next steps.
Alert Lifecycle
An alert moves through the following states:
1
2
3
4
5
6
7
Condition met
     |
     v
[triggered] -------> [acknowledged] -------> [resolved]
     |                                             ^
     |_____________________________________________|
           Condition clears (auto-resolve)
| State | Description | Who changes it |
|---|---|---|
triggered |
Condition first detected | TINAA automatically |
acknowledged |
Someone is investigating | User (dashboard or API) |
resolved |
Condition no longer met | TINAA automatically, or user manually |
Alerts that remain triggered for more than 2 hours without acknowledgement will re-notify the configured channels (escalation). This is configurable per rule.
Acknowledging an Alert
Via the dashboard: click the alert in the Alerts list and click Acknowledge.
Via the API:
1
2
POST /api/v1/alerts/{alert_id}/acknowledge
X-API-Key: <your-api-key>
Resolving an Alert Manually
1
2
POST /api/v1/alerts/{alert_id}/resolve
X-API-Key: <your-api-key>
Alert History
TINAA retains the full alert history for 90 days. View it in Alerts > History in the dashboard, or query via the API:
1
2
3
4
5
# All alerts in the last 7 days
GET /api/v1/alerts?days=7

# Filter by severity and product
GET /api/v1/alerts?severity=critical&product_id=checkout-service&days=30
Next Steps
- Metrics and APM — understand the data that drives alert conditions
- GitHub Integration — link alerts to GitHub issues and PRs
- Configuration Reference — configure alert channels via environment variables
- Quality Scores — understand what drives quality score alerts